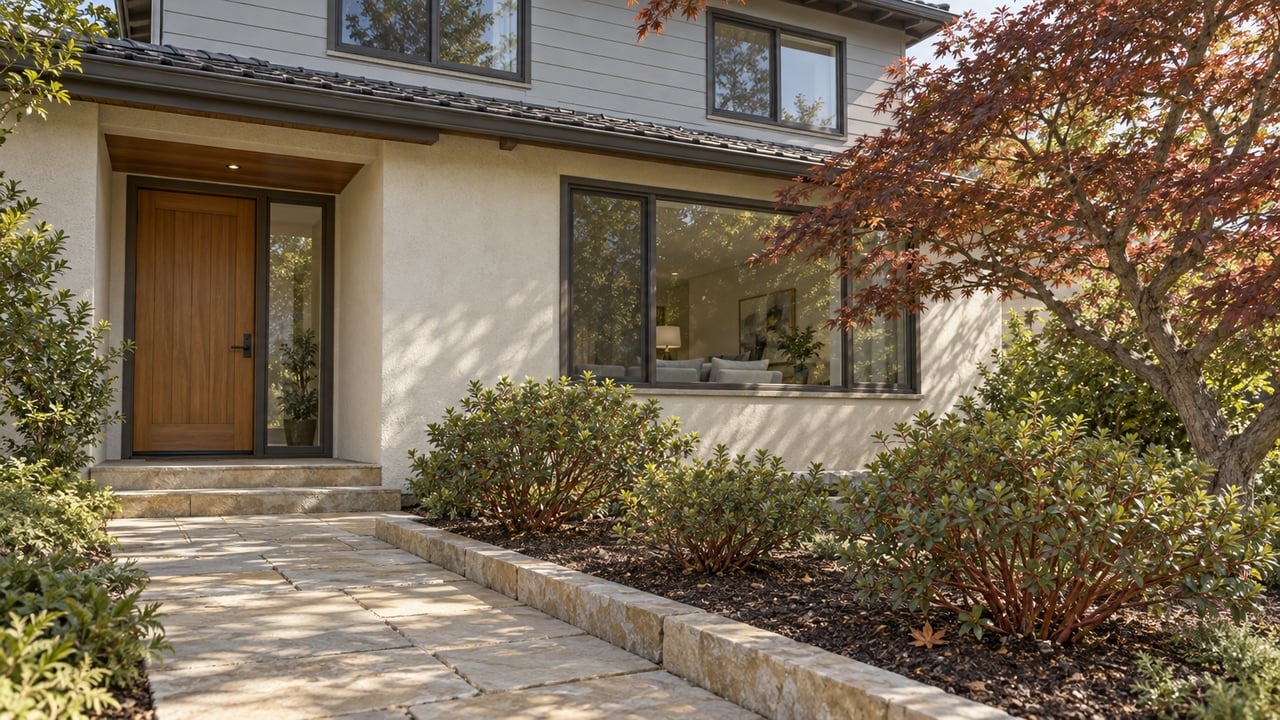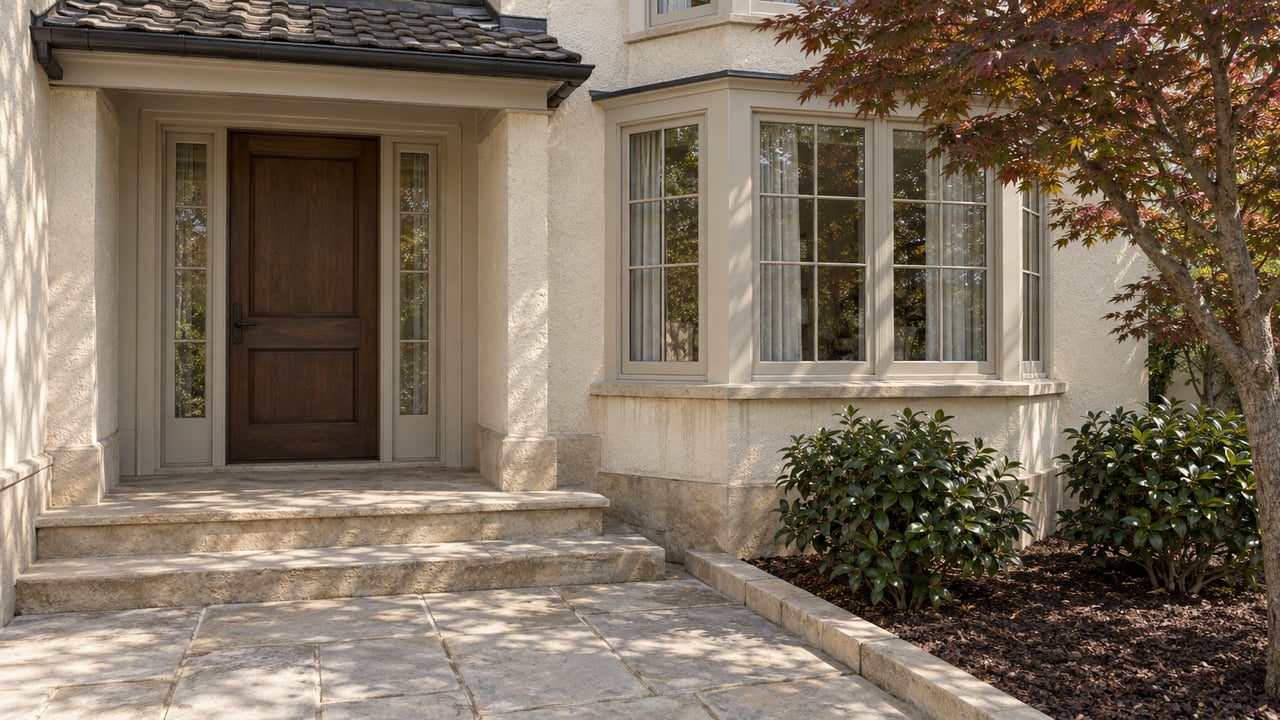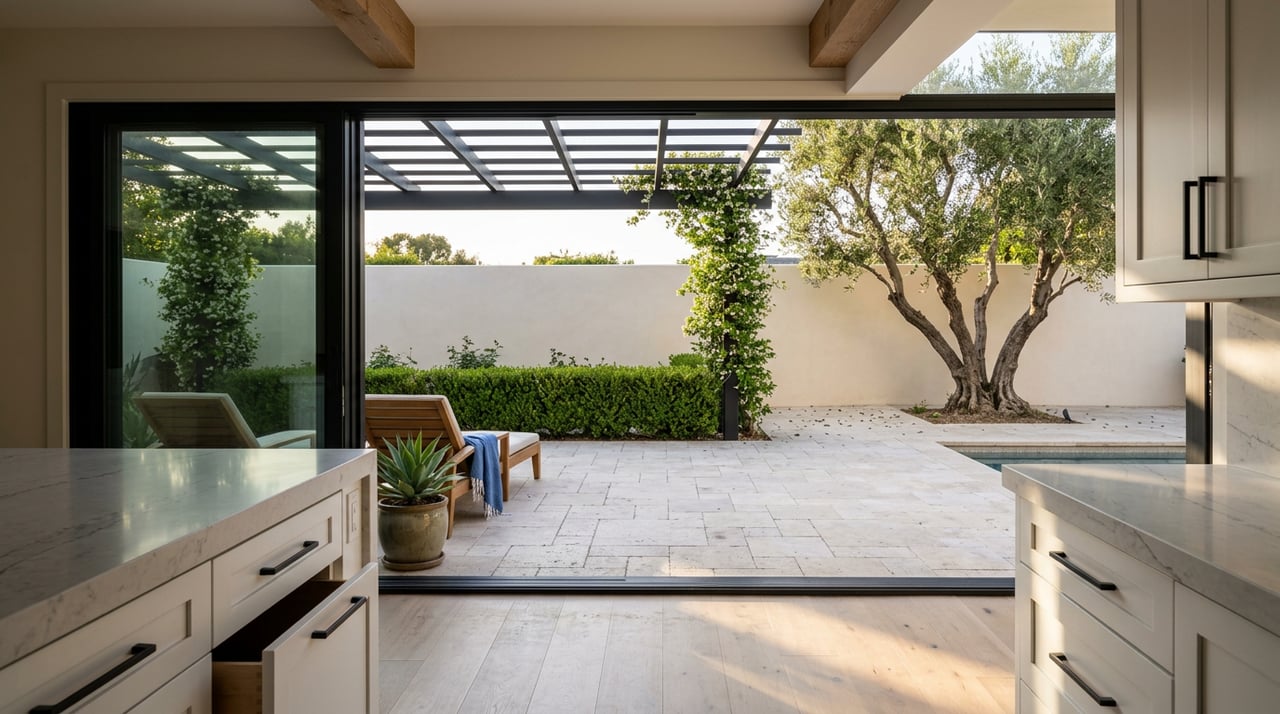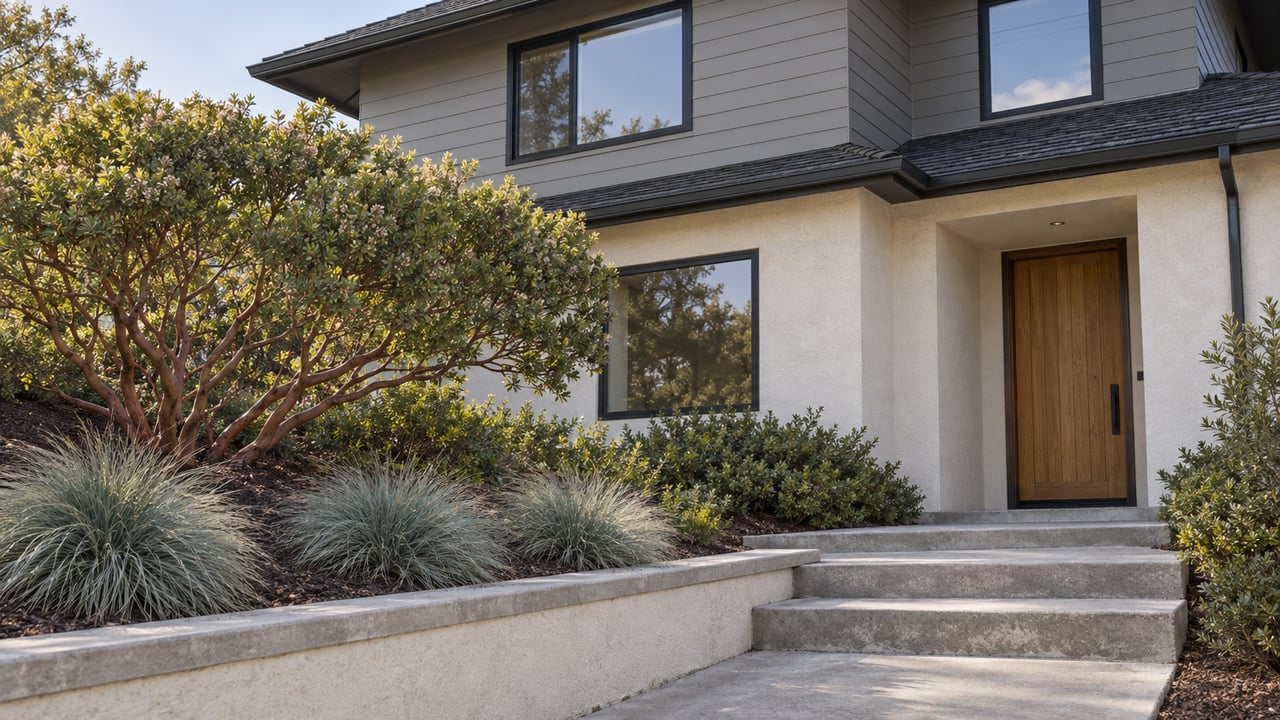
Four homes closed in Pacific Manor this summer. On July 29, a two-bedroom, two-and-a-half-bath condo at 270 Beachview Ave sold for $1,300,000. On August 25, a 910-square-foot, two-bedroom bungalow at 335 Monterey Rd sold for $870,000. Two days later, a 2,595-square-foot, four-bedroom house at 13 Connemara Dr closed at $2,288,800. Then on September 16, a three-bedroom at 483 Heathcliff Dr sold for $1,420,000, 19 percent over its $1,198,000 list price.
Pull the "Pacific Manor average" the day after that first closing and you get one number. Pull it again three weeks later and the number has moved by hundreds of thousands of dollars, not because the neighborhood shifted under anyone's feet, but because a different small batch of homes happened to close. That's the mechanism worth understanding before you use any Pacifica neighborhood's reported price change to compare it against another.
What Four Sales Can Do to an Average
A 910-square-foot bungalow and a 2,595-square-foot house sitting a few blocks apart in the same reporting area are not the same product, even if both get filed under "Pacific Manor" in a market report. Average any three of those four Pacific Manor sales and drop the fourth, and the resulting number swings by a large margin depending on which one you cut. That's not a flaw specific to Pacific Manor. It's what happens anywhere a named pocket of Pacifica generates a handful of closings in a given stretch and a portal turns that handful into a single headline percentage.
Look at how this plays out across other pockets over the same year. In the three months ending May 2026, Linda Mar recorded 18 sales and a median price of $1.3 million, down 15.7 percent from the same period a year earlier. One month later, a different Redfin snapshot showed Linda Mar's average house price at $1.39 million, up 8.2 percent year over year. Same neighborhood, same general season, opposite signs.
Zoom out to a full trailing 12 months and the Linda Mar numbers settle down: a median in the high $1.29 million to $1.32 million range, up somewhere in the high single digits to low double digits from the prior 12-month period. The longer the window, the more the outliers cancel each other out. The shorter the window, the more one expensive remodel or one distressed fixer can flip the entire reported trend.
Here's how that plays out across a few named Pacifica pockets in 2026, using the most specific windows and sale counts available for each:
| Reported Change | Window | Sales Counted | |
|---|---|---|---|
| Fairmont | +16.8% | 3 months ending July 2026 | 8 |
| Linda Mar | -15.7% | 3 months ending May 2026 | 18 |
| Park Pacifica | -6.6% | 3 months ending June 2026 | 21 |
| West Linda Mar | -18.3% | Year over year, June 2026 | Not separately reported |
| Pacifica citywide | -0.64% | Year over year, August 2026 | Full-city sample |
Notice that Fairmont's 16.8 percent gain sits on an 8-sale sample; West Linda Mar's sales count isn't separately reported, so its 18.3 percent decline can't be compared by sample size. The citywide number, drawing on every sale across the whole city, comes in close to flat. That's not because Pacifica is boring. It's because a bigger sample absorbs the outliers that would otherwise swing a small one.
Where the Real Premium Lives
None of this means Pacifica's much-discussed sun premium is imaginary. It's real, and it's documented by people who work the market every day. According to Homes.com's local guide, Pacifica-based Realtor Teresa Hoskins of Keller Williams Advisors calls Linda Mar "the sunniest neighborhood in Pacifica," where the valley opening lets the marine layer clear faster than it does over ridge-facing or ocean-facing blocks elsewhere in the city.
But the premium doesn't live at the scale most people compare it at. Buyers and agents in Pacifica have long used an informal shorthand, the "banana belt," for the sunnier southern pockets where fog burns off earlier. Inside Linda Mar itself, listings routinely single out a specific area known as Sun Valley as one of the city's most desirable microclimates, distinct even from the rest of Linda Mar. That's a meaningfully smaller unit than the neighborhood tag most price reports use. Treating "Linda Mar" as a single climate zone, when the real sun premium concentrates in a named pocket within it, is the same statistical error as averaging that Pacific Manor bungalow against the four-bedroom house down the street: you're blending things that don't move together.
Sun Isn't the Only Variable Hiding in the Comparison
Housing stock adds another layer that a raw price comparison flattens out. Fairmont was built largely by developer Henry Doelger in the late 1940s, giving it a cohesive tract character with two well-used playground parks and a shopping center at Hickey Boulevard and Highway 1. Sharp Park traces back to the Ocean Shore Railroad era, with homes dating to 1906 sitting alongside a turreted hillside building known locally as The Castle and Pacifica's only cliffside mobile home park. Vallemar's homes follow meandering Calera Creek under trees planted nearly a century ago, ranging from small bungalows to custom estate homes on the same street. You can read more about how the city itself describes these distinctions on Pacifica's own neighborhoods page.
When two pockets show different price trends, part of that gap is climate. Part of it is simply that one pocket is a uniform 1948 tract and the other is a mix of century-old cottages and custom rebuilds. A percentage change alone doesn't tell you which force did the work.
There's a maintenance dimension too, tied to the same geography that produces the sun premium. Exposed, ocean-facing blocks see more salt air and wind, which accelerates wear on railings, fasteners, exterior lights, and HVAC components. Sheltered pockets behind dunes or low hills, the same pockets that run sunnier and warmer, tend to see less of that corrosion. That's a real, ongoing cost difference between pockets, separate from the sale price itself, and worth factoring in alongside whatever premium the sunnier location commands.
What This Means If You're Comparing Pockets
If you're weighing Linda Mar against Park Pacifica against Vallemar based on a single month's or quarter's reported percentage change, you're mostly comparing sample noise. A neighborhood tag that generated 8 sales in one three-month window and 21 in another isn't giving you a stable read on direction. Ask for the actual list of closed comparables, addresses, dates, prices, and square footage, rather than accepting a headline average at face value.
If the sun premium specifically is what you're chasing, ask which named micro-pocket a property sits in, not just which broad neighborhood. Sun Valley within Linda Mar is a documented example of a premium that's real at a scale smaller than the labels most reports use. And if you're comparing upkeep costs as part of the decision, factor in that a sunnier, sheltered block often means less corrosion-related maintenance over time than an equivalent house facing the open ocean.
FAQ
Is Linda Mar actually the sunniest neighborhood in Pacifica? Local agents describe it that way, and the geography backs it up. Linda Mar sits in a valley opening that lets the marine layer clear faster than it does over more exposed or ridge-facing parts of the city. Within Linda Mar, the specific pocket known as Sun Valley is marketed as one of the most sun-favored microclimates in Pacifica.
Why do neighborhood price reports for the same area sometimes disagree? Because they're often built from different windows and small sample sizes. Linda Mar showed a median down 15.7 percent over a three-month window ending May 2026, based on 18 sales, while a separate snapshot around the same time showed an average up 8.2 percent year over year. Both can be accurate reflections of a tiny, shifting sample rather than a real trend reversal.
Does a foggier location actually cost more to maintain? Salt air and wind on exposed, ocean-facing blocks accelerate corrosion on railings, fasteners, exterior lighting, and HVAC components. Sheltered pockets tend to see less of that wear, which is a real ongoing cost difference beyond the purchase price.
How many homes actually sell in a given Pacifica neighborhood each month? It varies widely by pocket. Recent windows show as few as 8 sales in three months in Fairmont and around 18 to 21 in Linda Mar and Park Pacifica over similar periods. Citywide, Pacifica saw 29 sales in March 2026. Those are examples of the sample sizes behind neighborhood percentages.
If you're comparing specific Pacifica pockets and want the underlying closed-sale list behind a headline number, not just the average, I'm happy to pull it for the streets you're actually considering. Reach out to Andrew Klink for a straight read on what's actually sold, where, and why.